

The beginning of many school years often starts with an analysis of the previous year’s results. This can be a complex and time-consuming business which can send a number of more “statistically challenged” teachers heading for a darkened room to lie down in. There is a balance to strike between having enough data to analyse in-depth without “analysis for analysis” sake and the potential to miss the main learning points.
The #5MinResultsAnalysis
… has been produced by @LeadingLearner and @TeacherToolkit to guide you through the process of analysing your own/departments/phases/schools results and leads you towards “The Big Picture”, so you know what went well and what you want to improve for this year’s classes.
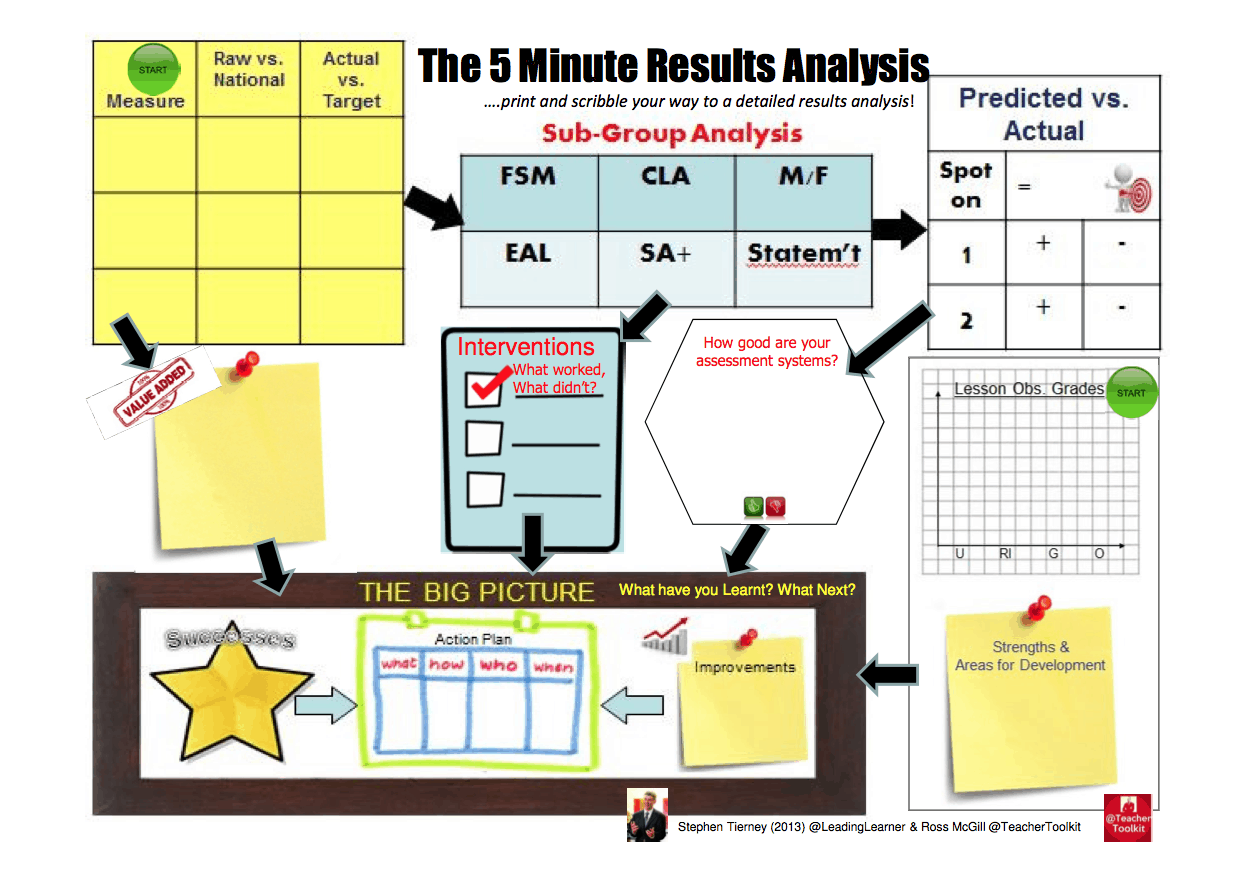
The #5MinResultsAnalysis looks at data, interventions, assessment systems and the quality of teaching. The Reducing In-school Variation: Making Effective Practice Standard Practice Report looked at variations, in the same school between departments/phases or across years, as a combination of the “variation in the quality and effectiveness of approaches to teaching and learning” or “variation in policies and procedures”. The #5MinResultsAnalysis has a look at both so there are two starting points – you decide where to begin.

Data Analysis

Measure (Starting Point)
There are a number of key measures that teachers and schools use – in primary schools, L4+ & L5+ and two levels progress, in secondary schools 5+A*-CEM, A*-C, A*/A, Average Point Score (Capped) and three levels progress with Sixth Forms looking at A*-E, A*-B, point score per subject & overall. The actual outcomes for these key measures can be compared against national averages and target grades.
Don’t forget to also look at a breakdown of the different parts of the exam or SAT – controlled assessment, different modules or papers etc. Is there a difference in how well students did?
Value Added
There are various value added measures that can be used. Some are produced by commercial companies but many are within the school’s RAISE. This document tends to come in later in the academic year. This measure is important because it places your own/school’s results in a context based upon a baseline of the children/students actually in your class/the cohort.
Sub-Group Analysis
We want all children/students to do well. Nationally there are some groups whose performance lags behind. In addition to those listed you may also want to look at different ethnic groups, travellers, children of forces personnel or transient children if there are a number in your class/school.
FSM: Free School Meals, CLA: Children Looked After, M/F: Male versus female, EAL: English as an Additional Language and children/students with special educational needs – SA+: School Action Plus & Statem’t: Statemented
Don’t forget G&T: Gifted & Talented children/students – are they making the progress expected and achieving top grades
Interventions
Many teachers and schools now have particular intervention programmes. At the moment these tend to be focussed on L4 and C/D borderline children/students. They require a great deal of commitment and resources to implement but which ones were effective and which ones were not?
The Sutton Trust & Education Endowment Foundation have produced a very useful analysis of the cost and effectiveness of various interventions used by schools – the report is here and a quick summary here. You may be surprised at their results! Having a quick look at their report may save you a lot of wasted time not to mention a bit of money.
Projected vs. Actual Grades
How accurate were the projected grades/levels given by you/teachers over the year? How many did you get spot on? How many one grade/level/sublevel out? Did you overestimate performance (+) or underestimate (-). Similarly with two grades/levels/sub-levels. This is increasingly important as knowing the level/grade a child/student is at (How are they going?) allows you to focus on the next stage in the learning for the individual. Also this data will be used to decide which children/students may require additional support – did you target the right ones?
Assessment Systems
This is a very important health check on one of the main systems found in schools. Did you or a member of your department/phase predicted very different results to those actually obtained. Do you have a clear system, followed by all teachers, on how to determine predicted grades/levels in a standardised way? Did you look to moderate each other’s’ judgements and link into test/examination boards?
If you want to look at this area in a bit more detail “Is Your Summative Assessment Trustworthy” may be of interest.
Over the past few years turbulence in examination grading has added to our challenge. What have you learnt about what is going on nationally that you can usefully use? Foundation or higher paper for borderline students? Are grade boundaries moving for some grades more than others? In some subjects more than others?
Lesson Observation Grades (Starting Point)
What was the class room experience of the children/students like? It is likely that you will only have a few snapshots through graded lesson observations but this just adds a bit to the picture. Where there any extenuating circumstances you need to take account of – absences, extended leave?

The Big Picture (What have you learnt? What Next?)
This is the important part! When you’ve looked at all the detail, what have you learnt? Don’t forget to capture what went well, you will want to do this again. Can you make these your/the departments super strengths? What do you want to improve for the next set of children students? Time to action plan. Who is going to do what by when and how? The clock is already ticking to next year’s rests and exams so no time to lose. Pick a few big issues that you can make a real impact on.

When choosing the few big issues to focus on remember to keep an eye on what you can influence and is in your control and what is not. There isn’t much point in fretting, getting annoyed or losing sleep on things that are simply not in your sphere of influence. The maddening changes to GCSE English grade boundaries in Summer 2012 is one such thing.
I hope that this year’s results were good for your children/students but if not try to step back and be objective in your analysis. All good headteachers look for an accurate, open and honest analysis of results. Talking of good headteachers, here’s a blog post from John Tomsett’s which may be of interest, “What I did as a Headteacher When Our GCSE Results were in Decline”.
The #5MinResultsAnalysis can be downloaded here:
Related articles
- The #5MinBehaviourPlan by @LeadingLearner and @TeacherToolkit (teachertoolkit.me)
- The #5MinBehaviourPlan by @LeadingLearner & @TeacherToolkit (leadinglearner.me)

Looks like it could be useful, especially for those who prefer a visual approach to numbers in a spreadsheet. At secondary, though, teachers also need to look at those who have made 4 or more levels of progress – to be good or outstanding you have to match or exceed the national percentages in your subject on this measure too.
Thanks for the comments Heather and useful tip.
This looks really interesting. We get subject leaders to do this kind of analysis and I’ll definitely show them this.
Increasingly schools push the kind of summary data in the top part of your sheet to departments. As you say, it’s the ‘Big Picture’ bit that’s important – the action that follows the number crunching – so more space for this?
What are : U RI G and O on the lesson observations?
U = stands for Unsatisfactory or Inadequate is sometimes used:
RI = Requires Improvement
Good = Good
O = Outstanding
Reblogged this on Clerk to Governors.
I think this is an excellent visual overview of the kind of information subject leaders should have at their finger tips regarding end of key stage assessment. Thank you.
Reblogged this on Teaching and Learning and commented:
First the #5MinLessonPlan then the #5MinMarkingPlan, whatever next?! Undoubetdy some of the most useful resources ever developed for and by teacherkind!